
Market Resilience: Navigating Defaults and Distress in Leveraged Loans
Significant Decline in Leveraged Loan Default Rate
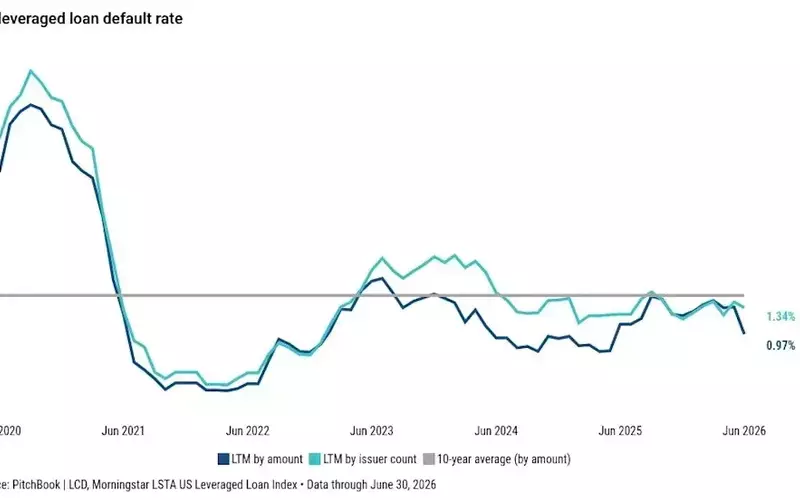
The leveraged loan default rate, measured by total amount, experienced a sharp reduction in June, settling at 0.97%. This marks a substantial decrease from the 1.35% recorded in May. The primary factor behind this drop was the removal of SFR's June 2025 default from the 12-month rolling calculation. SFR, an affiliate of Altice France, represented approximately $5.65 billion in term debt within the Morningstar LSTA US Leveraged Loan Index (LLI) at the time of its default.
Default Rate by Issuer Count Also Decreases
Correspondingly, the default rate based on the number of issuers also showed a slight decline, moving from 1.42% in May to 1.34% in June. This indicates a broader trend of fewer individual entities experiencing default during the month.
Absence of Liability Management Exercises and Dual-Track Default Rate Moderation
June saw no new liability management exercises, which contributed to a modest decrease in the dual-track default rate. This rate pulled back to 2.77% in June from 3.11% in May, reflecting a period of reduced distressed restructuring activity.
Distress Ratio Rises, Indicating Underlying Market Stress
Contrary to the declining default rates, the distress ratio—which gauges the proportion of loans trading at less than 80 cents on the dollar—increased by 34 basis points to 6.87% in June, up from 6.53% in May. This upward movement brings the ratio back to levels observed in April (6.83%) and suggests that while actual defaults have decreased, a segment of the market continues to experience significant financial pressure, though it remains below the year-to-date peak of 7.23% in March.
Overview of Trailing 12-Month Default Rates
As of June 30, the trailing 12-month default rates for the Morningstar LSTA US Leveraged Loan Index (LLI) were: 0.97% for payment defaults by amount (down from 1.35% in May), 1.34% for payment defaults by issuer count (down from 1.42% in May), and 2.77% for dual-track defaults by issuer count (down from 3.11% in May).
Current Payment Default Rates Aligned with Historical Averages
The current payment default rate levels are consistent with the running five-year and 10-year average monthly default rates, which slightly decreased to 0.96% and 1.51%, respectively, on a month-over-month basis, indicating a normalization of core default trends.
Understanding the Dual-Track Default Rate
LCD's monthly default report includes both the traditional payment default rate and a dual-track default rate by issuer count. The latter accounts for index issuers undertaking distressed liability management exercises (LMEs). Sixteen index issuers were involved in LMEs over the past 12 months, a significant reduction from 36 issuers in June 2025. The absence of new LMEs last month and the removal of three transactions from June 2025 led to the 34 basis point dip to 2.77% in June.
Future Default Rate Projections and LME Trends
Based on the PitchBook LCD Default Predictor, a six-month forward default rate of 1.69% by issuer count for legacy defaults is estimated. This model uses loan prices to forecast future default rates for the Morningstar LSTA US Leveraged Loan Index. Although legacy payment defaults have remained relatively stable, the number of LMEs has dramatically declined over the past year, reaching its lowest point since August 2023.
Sectoral Analysis of Liability Management Exercises
In terms of sectoral distribution, Healthcare Providers and Services accounted for 22% of LMEs over the past 12 months ending June 30. This was followed by Consumer Staples Distribution and Retail at 13% and Automobile Components at 9%. This represents a shift from May, where Healthcare Providers and Services made up 14% of LMEs, with IT Services and Software sectors each holding a 10% share.
Fluctuations in the Distress Ratio
The distress ratio by amount, which reflects loans trading below 80 cents on the dollar, increased by 34 basis points in June to 6.87%, reversing May's 30 basis point decline. This ratio has generally trended upward over the last nine months, reaching its 2026 peak of 7.23% in March, the highest level since December 2022.
Loan Downgrades Outpace Upgrades
The ratio of loan facility downgrades to upgrades rose to 1.25x in June on a rolling three-month basis, up from 1.18x in May. The May level was the lowest recorded since LCD began tracking this data in late 2022, indicating a recent acceleration in negative credit quality assessments.
Market Expectations for Year-End Default Rates
In PitchBook LCD's Q2 US Leveraged Finance Survey, 41% of respondents predicted a year-end loan default rate between 1.50% and 1.99%. Another 35% anticipated a rate between 2% and 2.99%, while 19% projected a rate from 1% to 1.49%. Six percent of those surveyed offered no opinion, highlighting a diverse range of expectations for the market's future performance.